The "Black Magic" of the Lab: Why Your Results Matter
Some chemists jokingly call gas chromatography "51% science and 49% black magic." After decades of troubleshooting ghost peaks and baseline drift in high-stakes laboratories, I’ve learned it’s actually a beautiful, predictable dance of thermodynamics. Whether you are running a routine gas chromatography analysis for ether purity or performing complex forensics, your gc chromatogram is more than just lines on a screen—it is a story of molecular behavior.
This guide isn't a textbook; it’s a distillation of years spent behind the GC-MS, designed to help you master how to read gas chromatography results and turn raw data into high-value insights.
Gas Chromatography Explained in Simple Terms: The "Airport" Analogy
When a new technician joins my lab, I skip the dense equations for a moment and provide gas chromatography explained in simple terms.
Imagine a crowd of people (your sample mixture) entering a busy airport terminal:
-
The Mobile Phase (Carrier Gas): This is the "Moving Walkway." It pushes everyone forward at a constant speed.
-
The Stationary Phase (The Column): These are the duty-free shops, coffee stands, and gates.
-
The Analyte Interaction: Some people (molecules) walk straight to their gate without stopping. They "elute" first. Others are attracted to the shops (the stationary phase), stopping to browse. They take longer to reach the exit.
The gas chromatography graph simply records when each "person" exits the terminal and how many of them there are. The time they spend in the airport is their Retention Time ($t_R$).
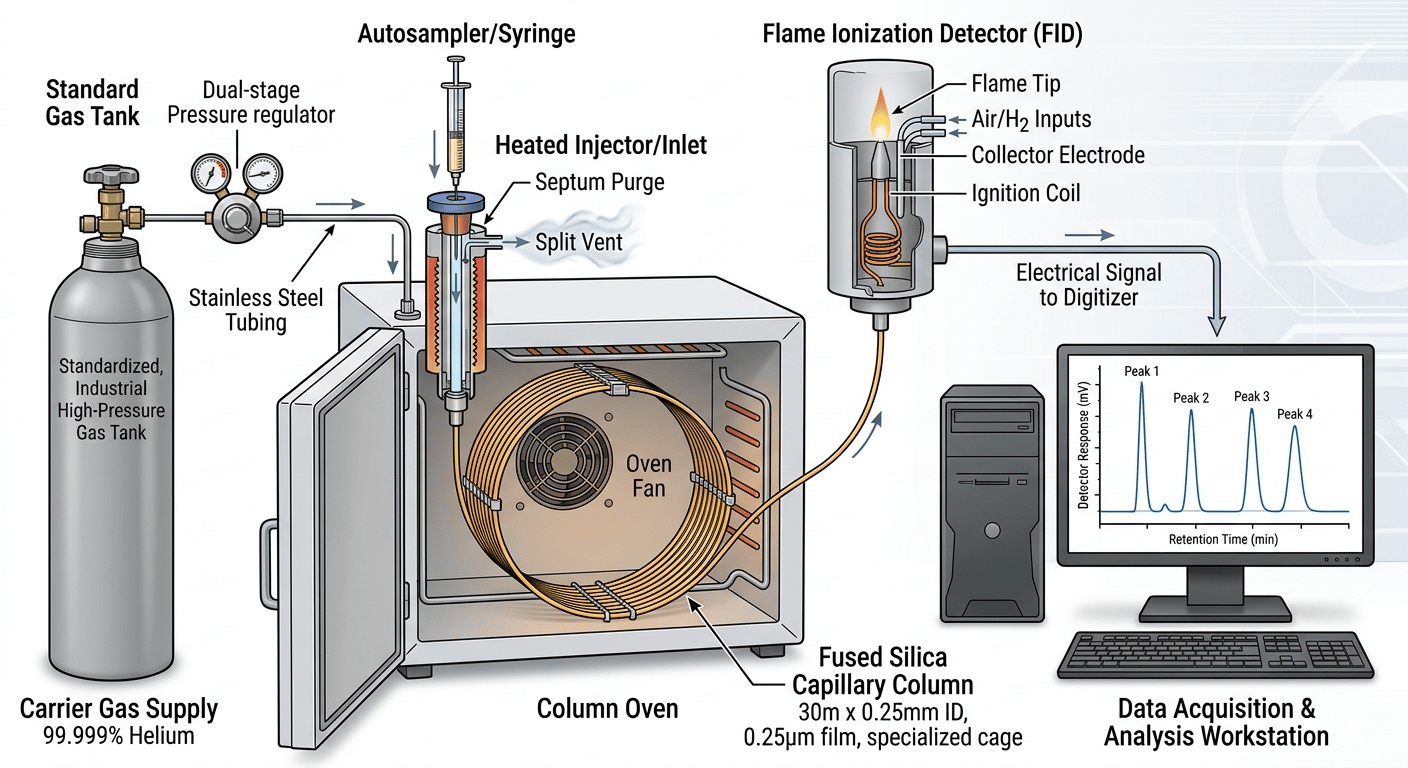
This diagram breaks down the main components, providing the "big picture" for anyone learning gas chromatography explained in simple terms.
What is GC Analysis? Beyond the Basics
If you’ve ever asked, "What is gc analysis?" at a fundamental level, it is the gold-standard separation technique for volatile and semi-volatile compounds. In my practice, we use it because it is incredibly sensitive—capable of detecting parts per billion (ppb).
In gas chromatography analysis, we rely on the fact that different molecules have different vapor pressures and different affinities for the chemicals inside our columns. If your compound can be turned into a gas without decomposing (thermally stable), GC is your best friend.
Key Applications of GC Chromatography:
-
Pharmaceuticals: Checking for residual solvents in drugs.
-
Environmental: Hunting for pesticides or VOCs in water and soil.
-
Forensics: Determining Blood Alcohol Content (BAC) or detecting illegal substances.
-
Food & Beverage: Analyzing flavor profiles in wine or detecting contaminants.
The Hardware: Where Precision Meets the Bench
A perfect gc chromatogram starts long before the detector. It starts with your hardware.
1. The Inlet: The Gatekeeper
Most people overlook the injection port, but this is where 80% of problems occur. Whether you use split or splitless injection, the goal is rapid vaporization.
2. The Analytical Column: The Heart
Modern labs use Fused Silica Wall-Coated (FSWC) capillary columns.
-
Non-polar columns: Best for general hydrocarbons.
-
Polar columns: Essential for alcohols, acids, and ethers.
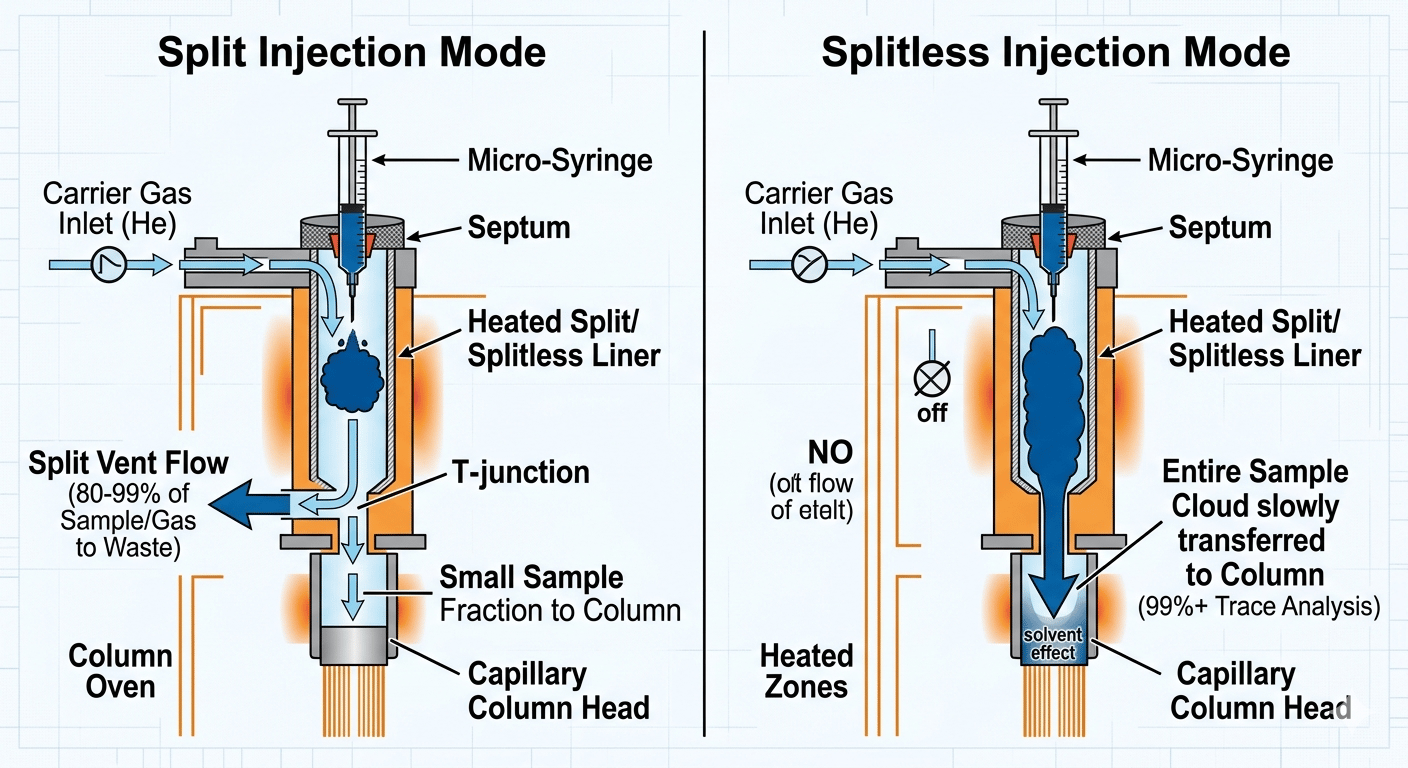
Comparison of split and splitless gas chromatography injection modes.
Gas Chromatography Detectors: Choosing the Right "Eye"
The detector converts separated molecules into an electrical signal, creating your gas chromatography graph.
| Detector Type |
Best For |
Sensitivity |
Key Feature |
| FID (Flame Ionization) |
Hydrocarbons / Organics |
High |
The "Workhorse." Reliable and rugged. |
| TCD (Thermal Conductivity) |
Universal / Inorganic |
Moderate |
Non-destructive; can collect sample. |
| MS (Mass Spectrometer) |
Unknown ID |
Extreme |
Provides a "Molecular Fingerprint." |
| ECD (Electron Capture) |
Halogens (Pesticides) |
Ultra-High |
Picks up specific elements in complex matrices. |
How to Read a GC Chromatogram: Decoding the Peaks
To an expert, the gc chromatogram is a narrative of separation efficiency.
1. The X-Axis: Retention Time (t R)
This is the "address" of your molecule. Retention time is the interval from the moment of injection to the peak maximum. If peaks elute too fast (t 0), you lack "interaction"—you may need a cooler oven or a more polar column.
2. The Y-Axis: Response and Area
We don't just look at peak height; we look at Peak Area. Integration calculates the quantity. Pro Tip: Always double-check the "baseline" drawn by your software. If the baseline is skewed, your quantitative results for gas chromatography analysis will be wrong.
Quantitative Analysis: The Mathematics of "How Much?"
Quantitative gc analysis relies on the principle that the detector response is proportional to the amount of analyte. We use a Calibration Curve to calculate the unknown.
The Linear Equation:
The relationship follows the classic linear form. Since your backend does not support the formal symbols, I have provided the equation as a clean image that you can insert directly:
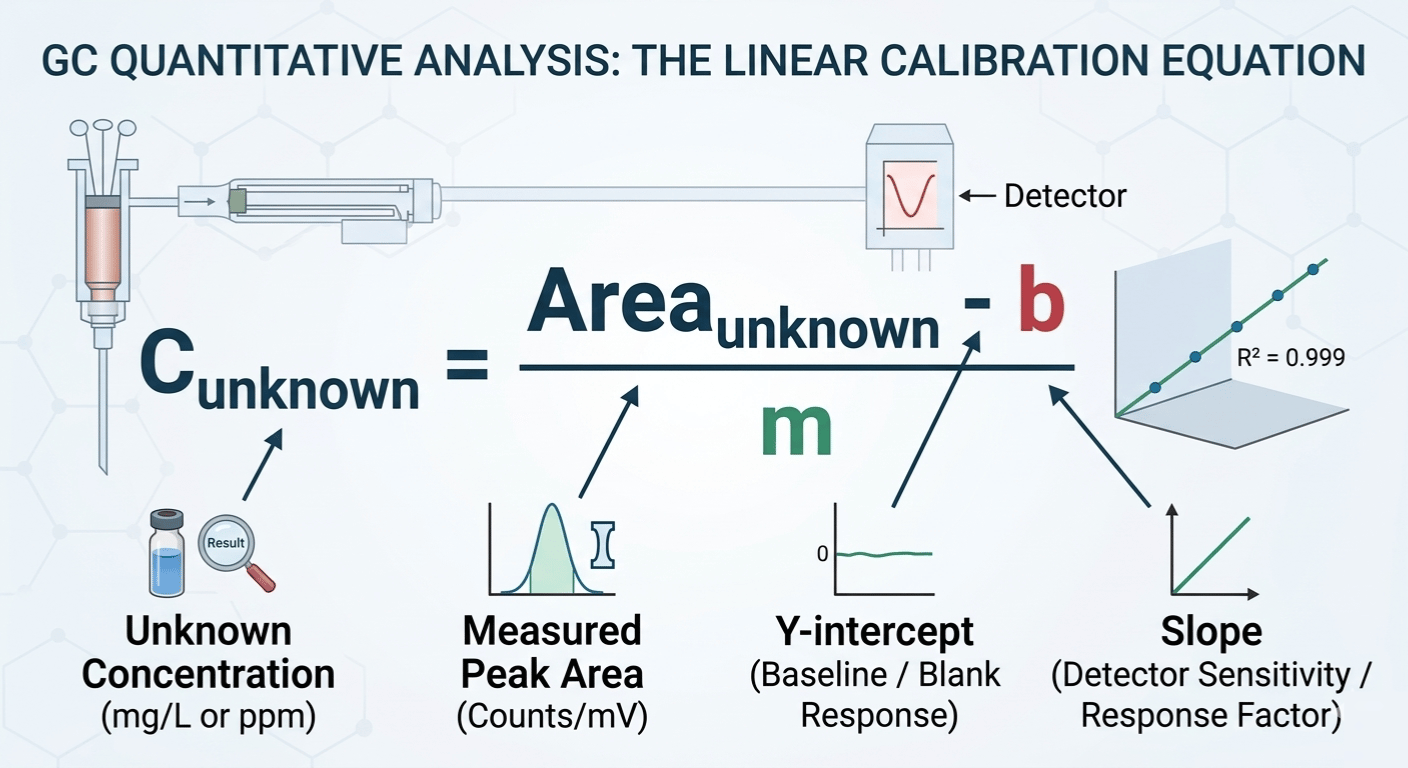
Where:
-
Area_unknown: The Peak Area measured by the detector.
-
b (Y-intercept): The response of the detector when concentration is zero (ideally near zero).
-
m (Slope): The sensitivity of the detector for that specific molecule.
To ensure accuracy, we also recommend plotting these points to confirm linearity, as shown in the calibration plot graphic below.
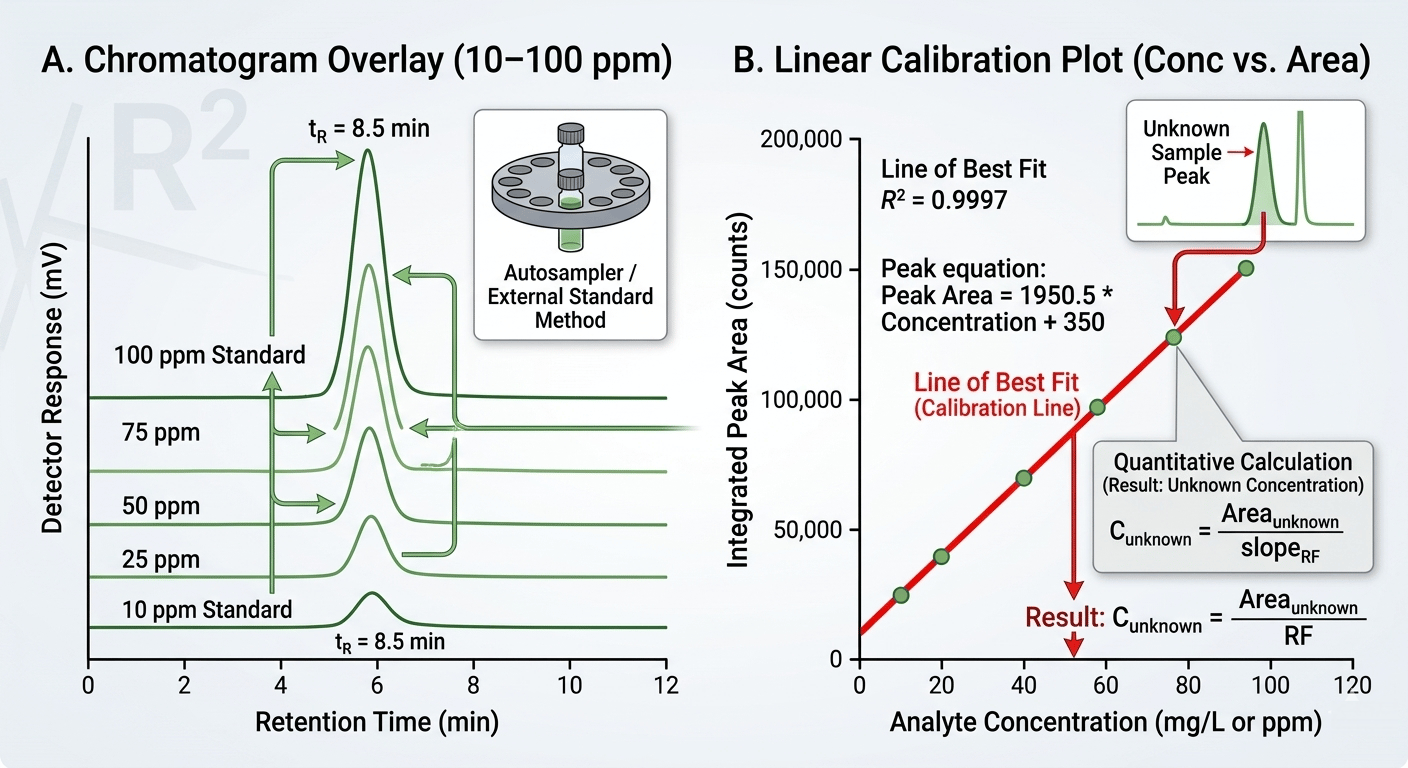
GC calibration curve graph showing the linear relationship between concentration and peak area.
Troubleshooting: Diagnosing Peak Shapes
Learning how to read gas chromatography results means diagnosing problems through peak shapes:
-
Peak Tailing (Right-side drag): Usually caused by "active sites" or contamination. Lab Fix: Trim 10cm off the column and replace the liner.
-
Peak Fronting (Left-side lean): Caused by Column Overloading. Lab Fix: Increase your split ratio or dilute the sample.
-
Baseline Drift: Usually indicates column "bleed" or temperature limits being exceeded.
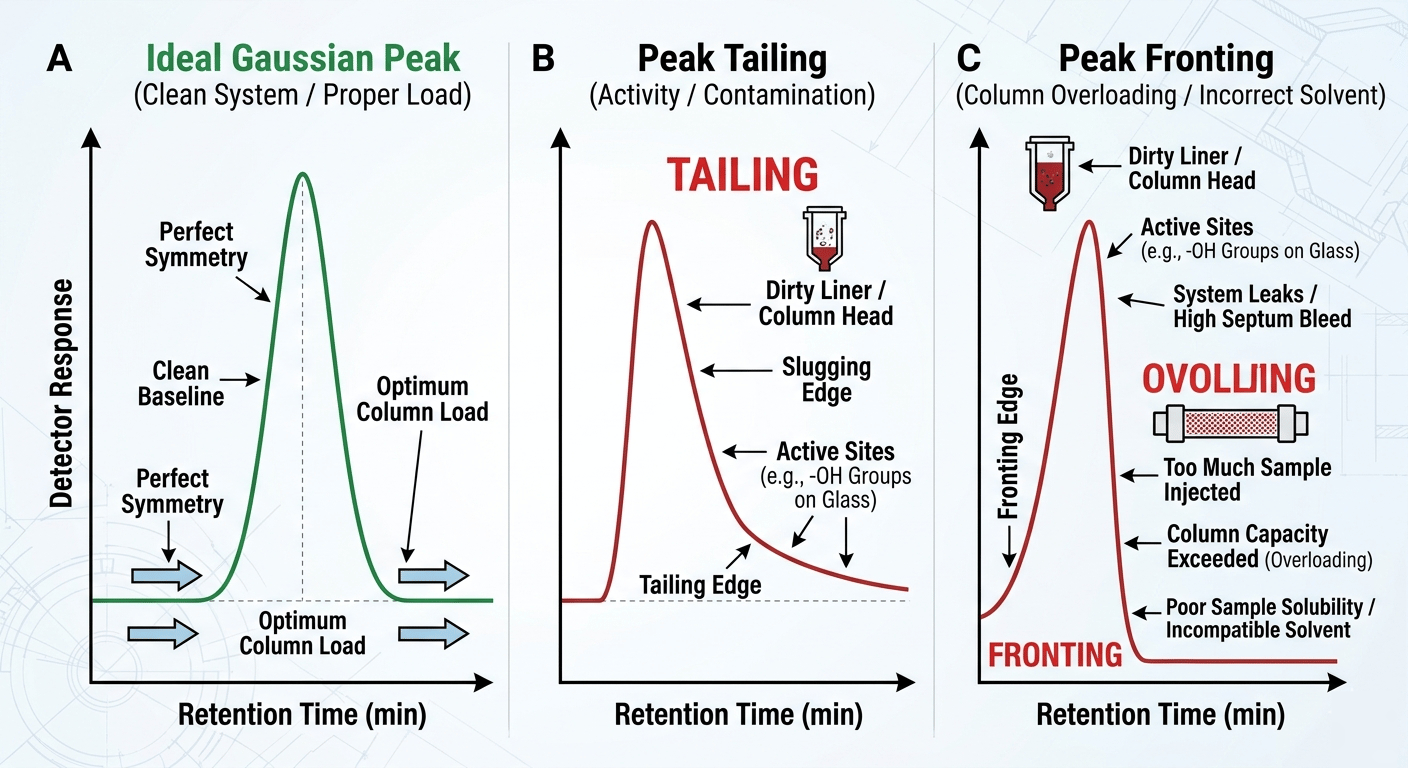
Diagnostic chart showing ideal, tailing, and fronting GC peaks.
Advanced Applications: The Power of GCxGC
For incredibly complex samples—like diesel fuel, perfumes, or environmental extracts—a single column often isn't enough. You get "co-elution," where two different chemicals exit the column at the exact same time, overlapping into a single peak.
To solve this, we use Comprehensive 2D Gas Chromatography (GCxGC). This setup connects two columns with different chemical polarities in series. The result isn't a simple 2D line; it is a 3D Contour Map.
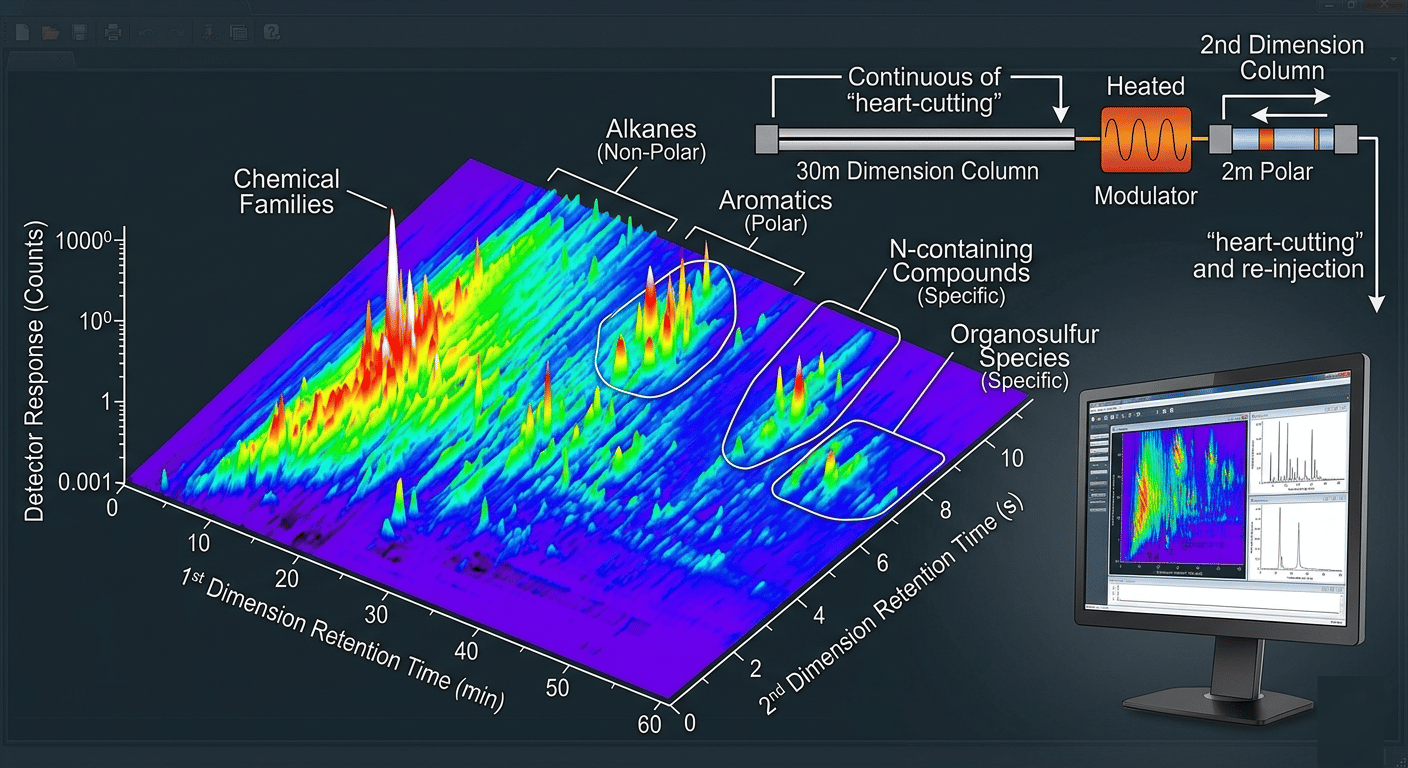 A vibrant 3D GCxGC contour plot showing chemical families like alkanes and aromatics separated by boiling point and polarity.
As you can see in the heatmap above, GCxGC allows us to resolve thousands of compounds in a single run. By separating by both volatility and polarity, we can "see" through the complexity that would normally hide trace analytes on a standard gas chromatography graph.
Conclusion: Quality In, Quality Out
Mastering gc analysis isn't just about reading a graph; it’s about controlling variables. In my experience, 90% of "bad chromatography" is traced back to low-quality consumables. Even a 1% error in your standard preparation or a leaky vial septum can ruin your R² value.
Don’t let bad data hold back your research. We specialize in the high-precision vials and consumables that the world’s leading labs trust to keep their baselines clean.
Expert Support for Your Lab
Need to optimize your lab workflow or source the highest-grade supplies? I'm here to help you solve the "black magic" of GC.
References & Technical Citations
Expert Insights & Methodological Sources
-
Turner, D. (PhD, FRSC). Advancements in Multidimensional Chromatography: Mastering the GCxGC Contour Plot and Peak Resolution. Technical Review on Complex Matrix Separation.
-
Analytical Science Collective. The Anatomy of Modern Gas Chromatography: From Inlet Linear Optimization to Detector Sensitivity (FID/MS/TCD). Lab Bench Series.
-
Aijiren Technical Lab. Quantitation and Calibration: The Linear Equation y = mx + b in Volatile Organic Compound Analysis. Internal Standards and Recovery Optimization Guide.
-
Chromatography Troubleshooting Workshop. Visualizing Peak Shapes: Identifying and Correcting Tailing, Fronting, and Baseline Drift in FSWC Columns.
-
Industrial Applications Series. Gas Chromatography for Peak Purity: From Pharmaceutical Residual Solvents to Environmental Pesticide Tracking.
 English
 Chinese